With an updated user-friendly design, a new badging feature, and advanced data and reporting tools, managing and measuring volunteering events has never been easier.
Starting in 2020 many aspects of our lives became largely digital, including volunteer management. GivePulse took this opportunity to assess our platform and optimize it for the new world of virtual volunteering, advocacy, and fundraising. We have expanded our solution to add four new features that make it even easier to manage and measure the impact of your events.
Old View out, New View in
Helping your community is rewarding and satisfying, and the discovery process should be too. Our design revamp makes it easier for users to find relevant information, particularly for our opportunities and groups pages.
New Explore Page
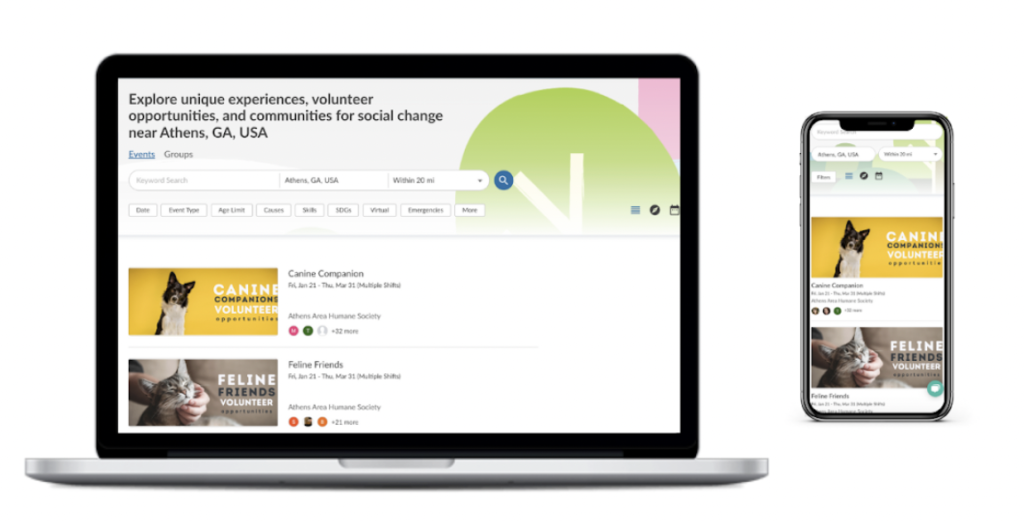
Events vs.Groups
Events imagery will now be rectangular, while Groups imagery will be circular, enabling volunteers to find opportunities more quickly.
Larger Event Image
Larger images will more quickly capture interest. Did you know that 65% of people are visual learners? As much as we love reading, the majority of us will be more enticed to click into an opportunity based on the imagery we see. Make sure your event image tells a compelling story!
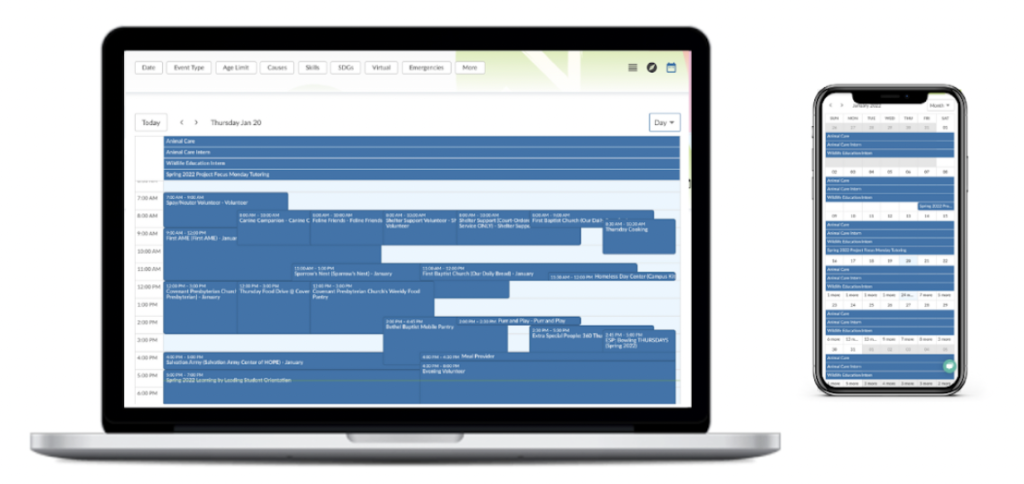
Calendar View
Limited time and availability to volunteer? Quickly scan all available opportunities in an area by date with the calendar view.
Enhanced Mobile View
Enables easier discovery of events and opportunities on the go.
New Group Page
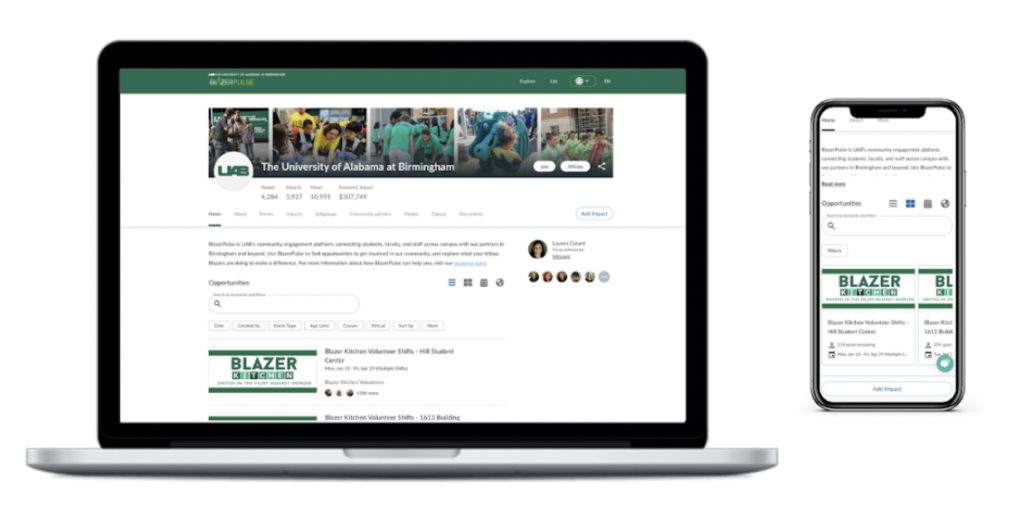
Prioritized Opportunities Section
Volunteers can find the opportunities they are most interested in more easily.
Card View
Easier discovery of opportunities in mobile view.
Impact Cards
Visually communicate the impact your organization is making in the community.
New Event Page
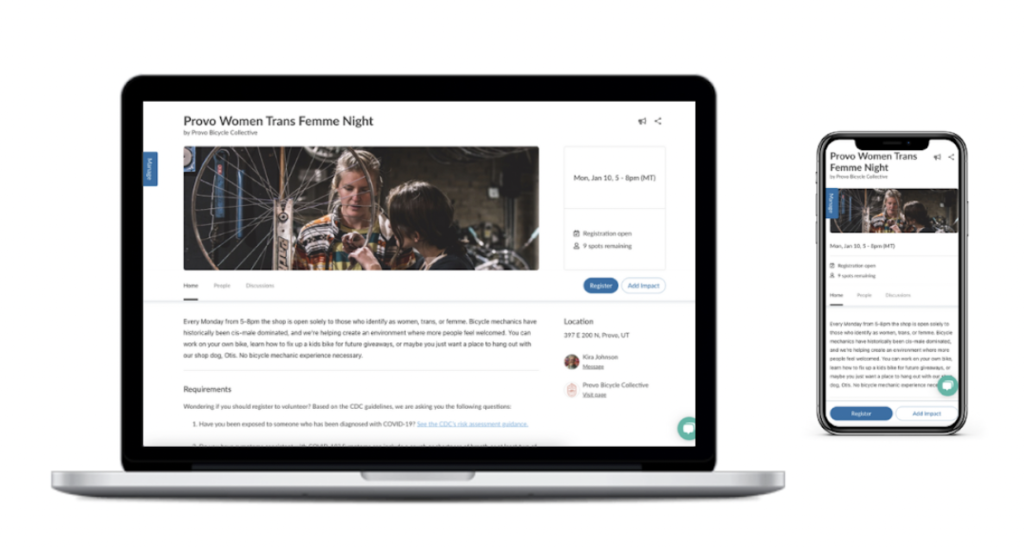
Simplified Call to Actions
Help prioritize event registrations.
Prioritized Real Estate for Image Assets
Tell a more compelling story to encourage registrations.
Anchored Management Actions
Now consistent between administrators and participants’ views.
Community Section
Summarizes your most active partners.
Impact Cards
Visually communicate the impact your organization is making in the community.
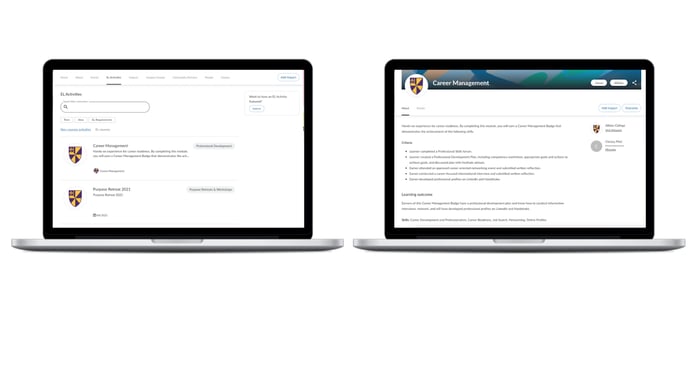
Learning Modules
Set up opportunities geared towards achieving specified learning outcomes and criteria for achieving them. Those criteria are also translated into specific tasks, which helps participants and administrators track progress towards completion.
Organizers can also include a reflection assessment as the final criteria for completing the learning opportunity.
As with many modules we have on the system, you will have an opportunity to update the learning module labels to suit your organization’s needs.
The learning module was updated to support Experiential Activities for a higher ed institution. Experiential Learning is a high-impact practice common to higher ed institutions – emphasizing taking learning beyond the classroom via hands-on experiences.
Through Learning Modules the learner is able to:
- Gain knowledge by acquiring concepts, facts, and information through formal learning and past experience.
- Apply the knowledge in a real world setting.
- Reflect on the experience and gain new ideas.
The GivePulse Learning Module enables learners to:
- Crowdsource Experiential Learning opportunities through the Experiential Learning submission process
- Track progress toward learning through our tasks list
- Assess learning outcomes through a reflection assessment
Badging
Badges are an easy and visual way to quickly distinguish accomplishments for your members. Award badges based on expertise in a skill, recognize individuals’ contributions to a particular cause, or leverage badges to celebrate your member’s accomplishments.
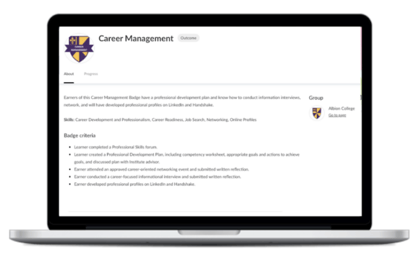
Reward Engagement
Badges can be set up to be awarded after the volunteer accomplishes a set list of tasks. The list can be reviewed by organizers or automatically awarded based on meeting a particular milestone, such as the number of verified hours toward a particular cause.
Visually Distinguish Participants
View your members’ badges to quickly ascertain if they have certain skills and acumen for a particular opportunity. You can also curate opportunities specific to each set of badge holders.
Auto Build an e-Portfolio
Badges awarded to individuals are automatically populated on their profile.
Easier Access to Data
Access to data helps organizations understand the current status of programs and initiatives, identify gaps, and take action to ensure success. We are introducing a new data grid to help you access your data more quickly and easily.
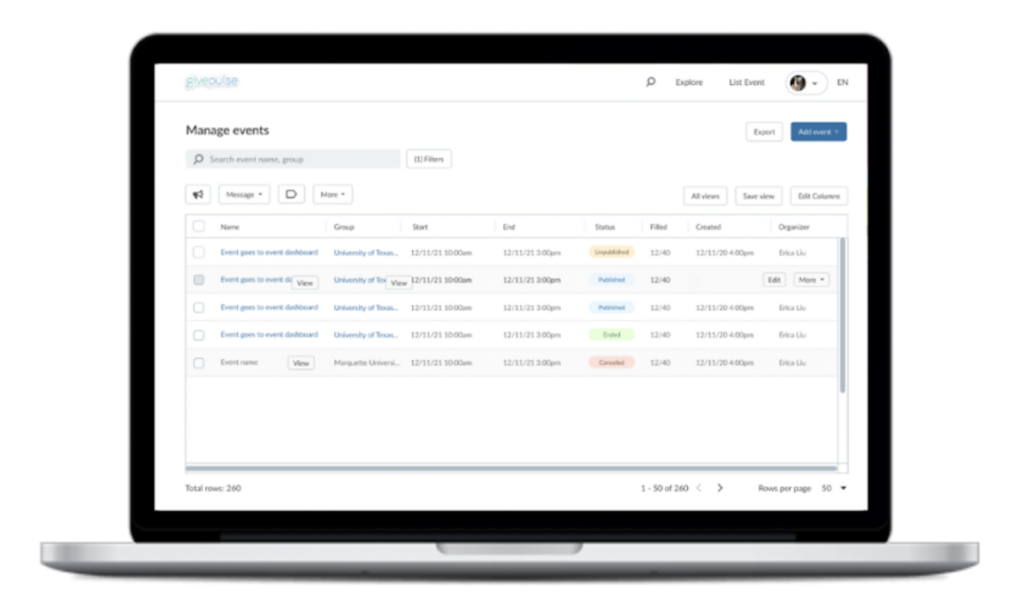
Overall Search on Common Fields
Enhancements to the overall search bar on the top left will now help you to easily sift through the most commonly searched fields, such as event name or group. You no longer need to specify a field.
Advanced Filtering Tools
For the data analyst that lives in all of us, we now offer multiple ways for you to slice and dice your data to fit your reporting needs. By stacking multiple filter conditions, you can narrow in on the specific set of records that fulfill the criteria you set. Be it, events created between certain dates, events created by a particular organizer, or events with impacts greater than 100.
Save View
If you consistently review the same reports, you can now save your filtered criteria, manage the grid with Save View, and access your reports more easily. No more reconfiguring your layout each time you need to see different sets of data. Just set it up once and refer back to the report next time you need it.
See More Data
Is more always better? Not necessarily, but in this case, we certainly think so. We’ve expanded the data grid to use more horizontal real estate so you can fit additional data into your view. You are still able to configure your grid to see only the most relevant information, but now can save those views!
Want to learn more about our new features? Let’s chat! Schedule a meeting at a time most convenient for you.